Portfolio
All Projects
A collection of interactive data visualizations, dashboards, and scrollytelling experiences.
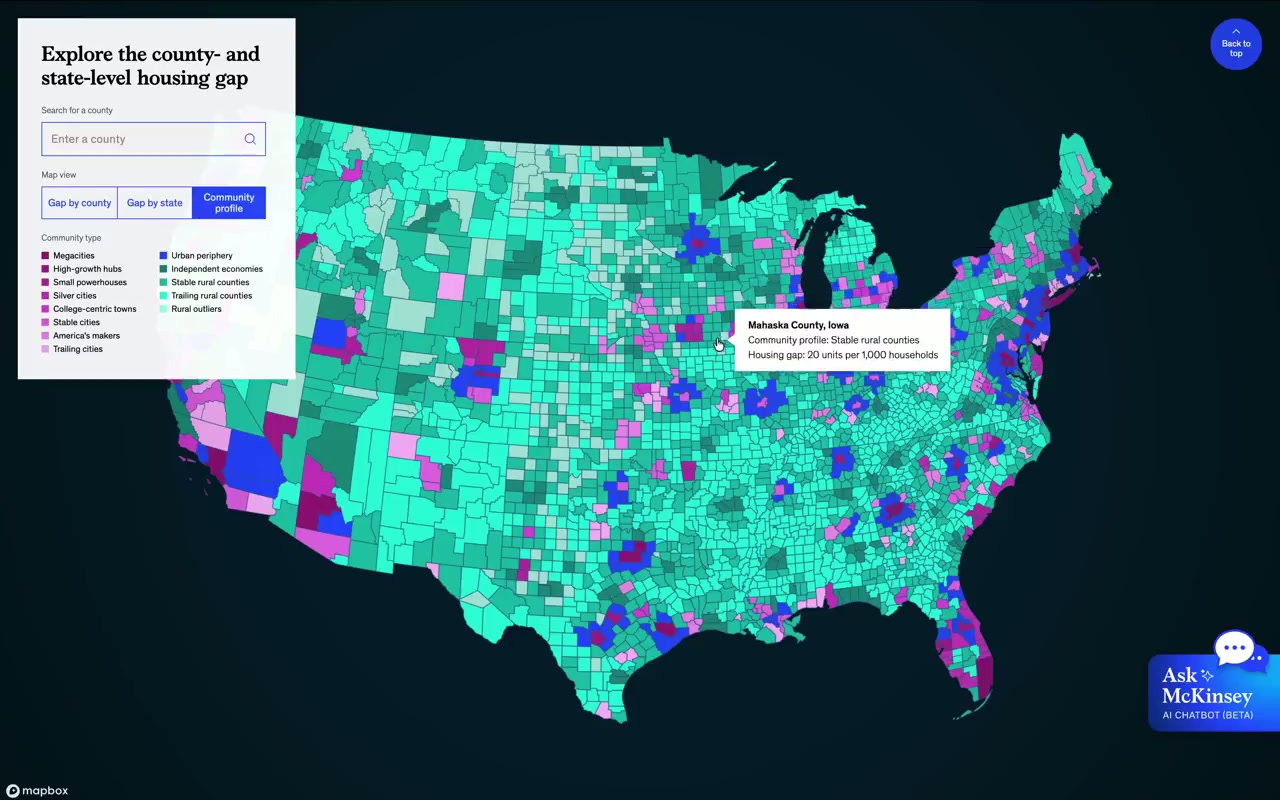
Mapping the US Affordable Housing Crisis
2025Interactive scrollytelling experience with immersive map-based storytelling about the US housing gap.
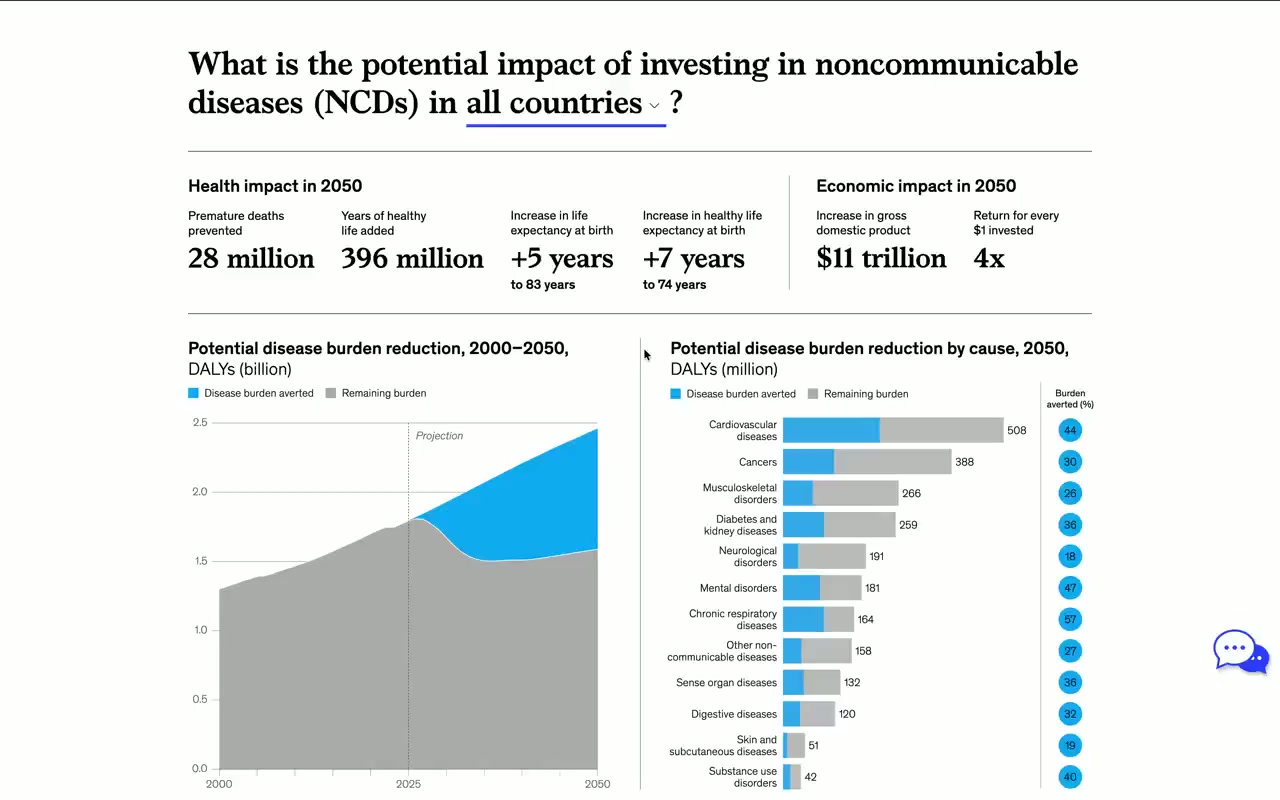
Investing in Addressing NCDs
2025Custom dashboard presenting country-level model estimates for disease burden reduction.
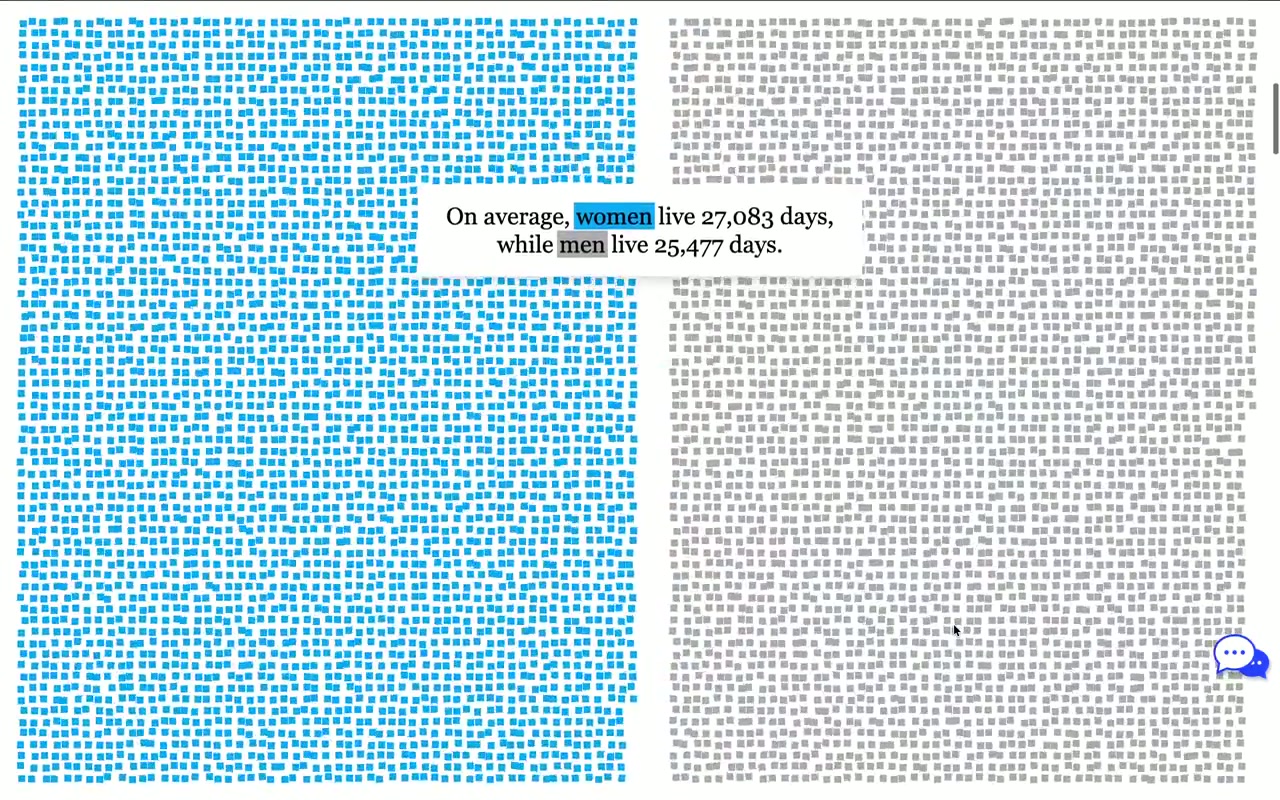
Women’s Health Gap — Scrollytelling Hero
2022Custom scrollytelling hero with multiple visual states and smooth transitions introducing the women’s health gap.
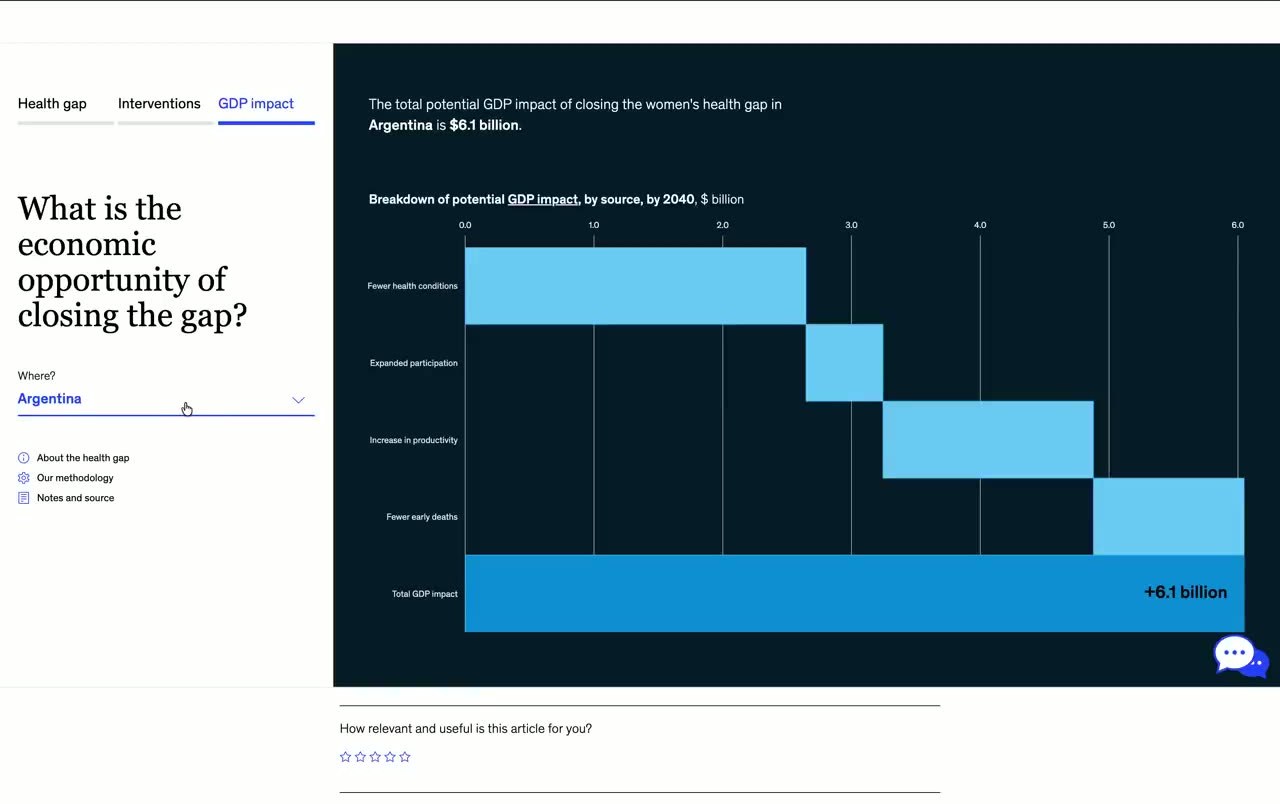
Women’s Health Gap — Interactive Dashboard
2022Interactive dashboard with multiple views, toggles, and dynamic contextual text exploring country-level data.
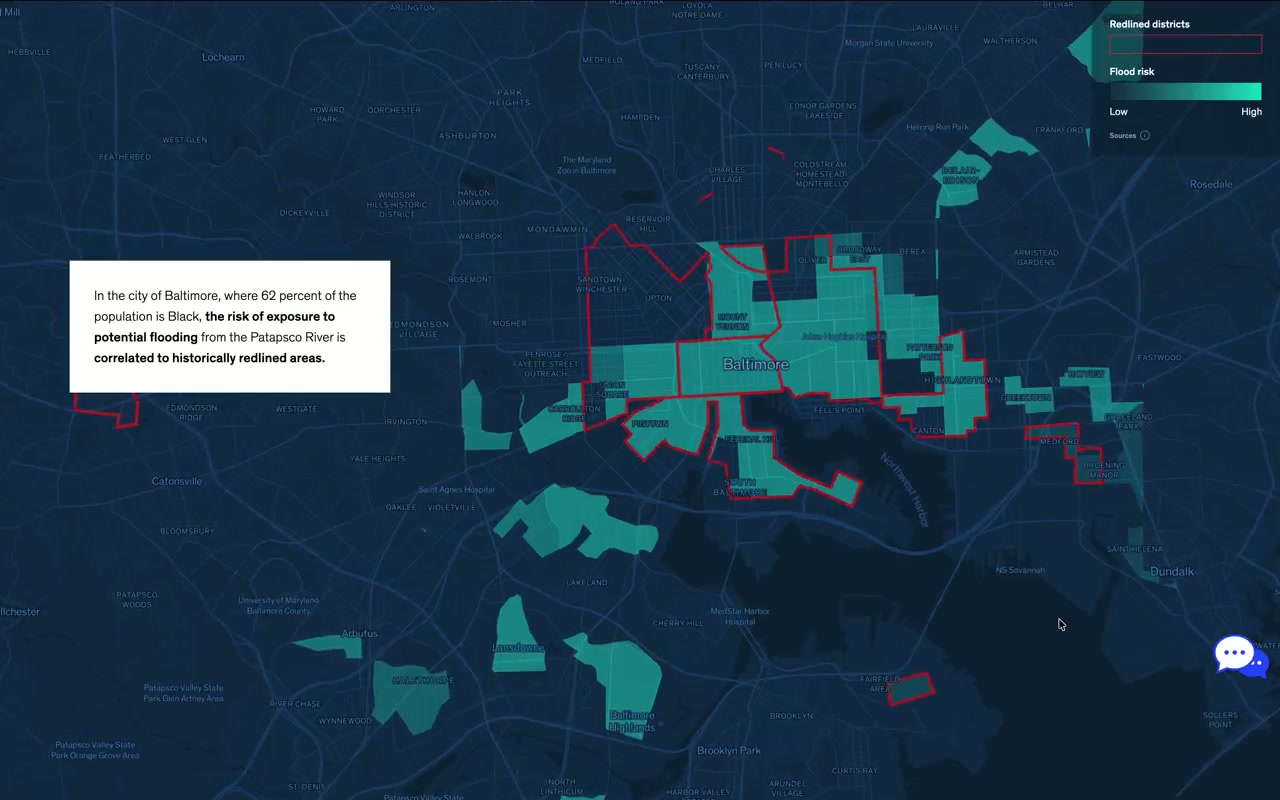
Impact of Climate Change on Black Populations
2022Scrollytelling experience featuring animated geospatial visualizations of climate impact disparities.
McKinsey Year in Review 2023
2023Multiple interactive experiences transforming static visualizations into dynamic storytelling components.
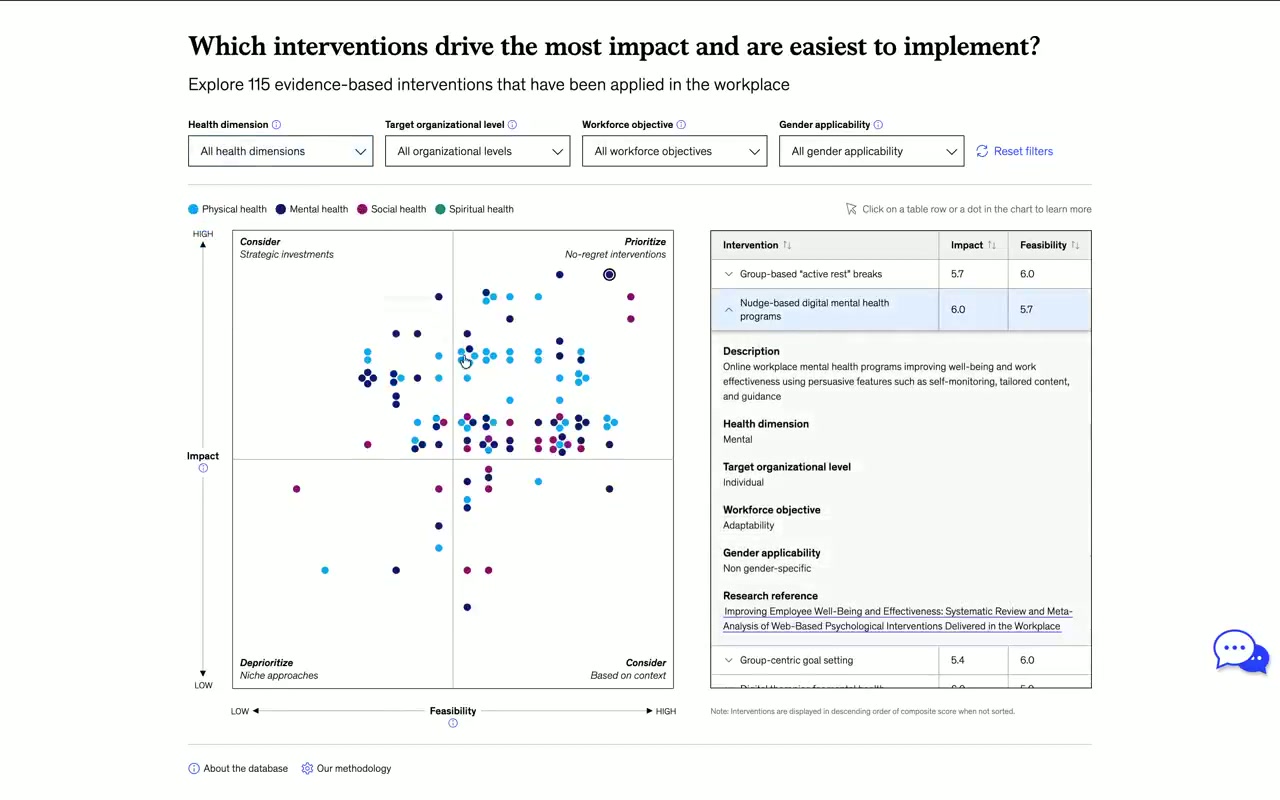
Workplace Health Interventions Interactive
2024Interactive decision-support tool visualizing over 100 workplace health interventions across impact and feasibility dimensions.
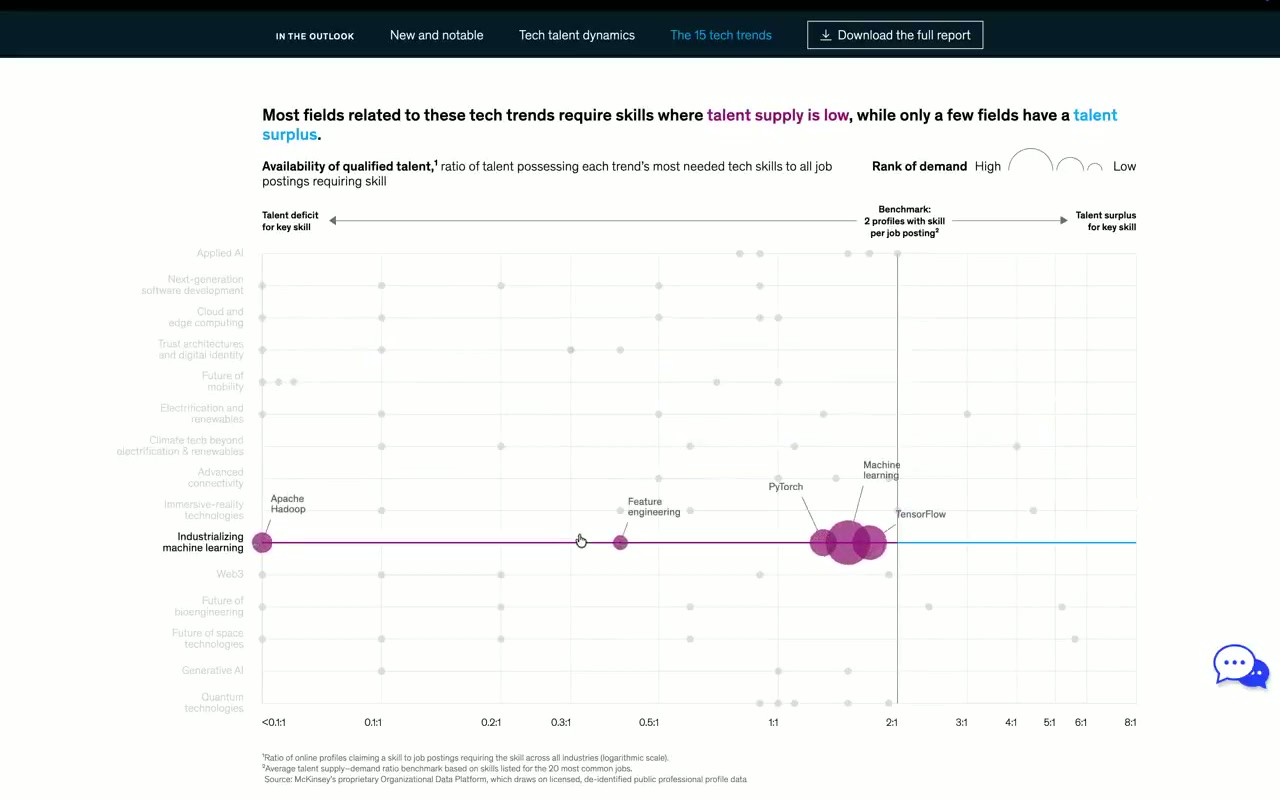
Tech Trends Outlook Interactive (Matrix & Explorer)
2023Interactive matrix and explorer for comparing emerging technology trends across multiple attributes.
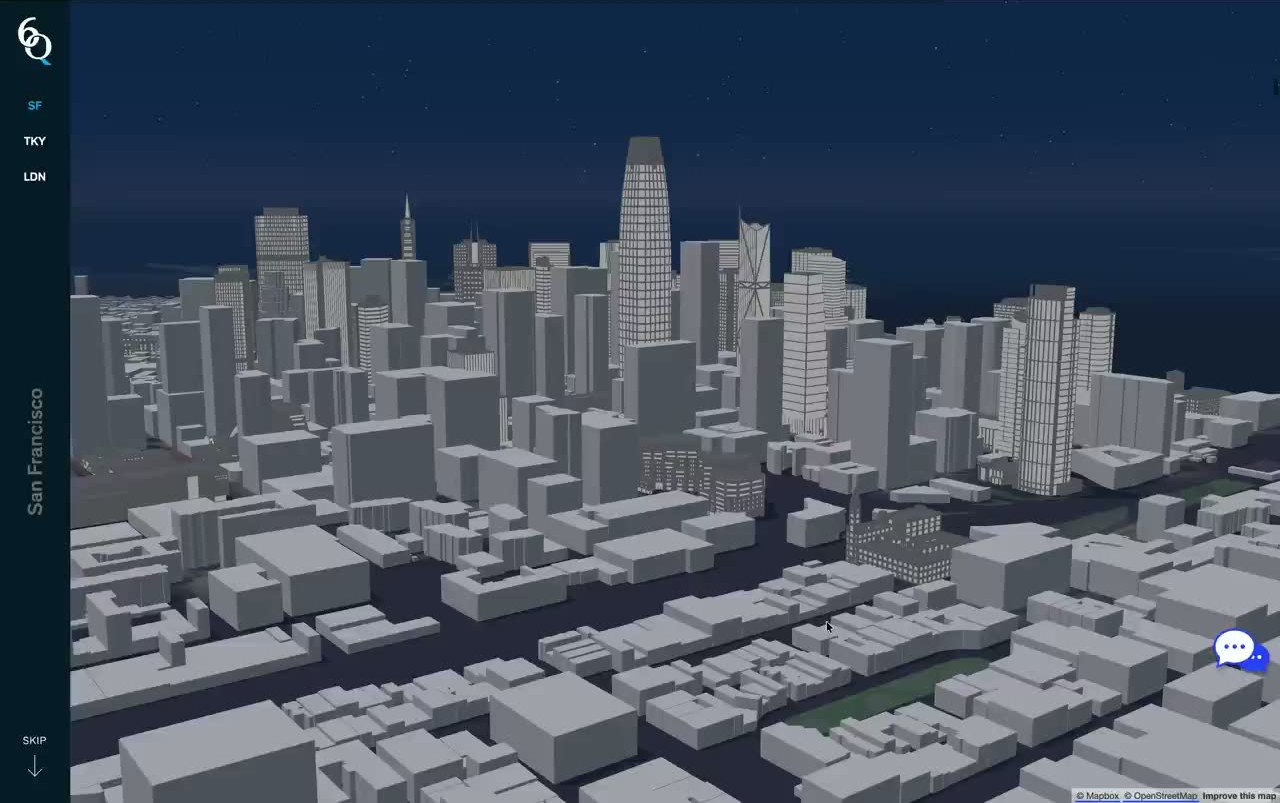
The Future of the Office Interactive
2023Immersive 3D, data-driven story exploring the future of office spaces across major global cities.